
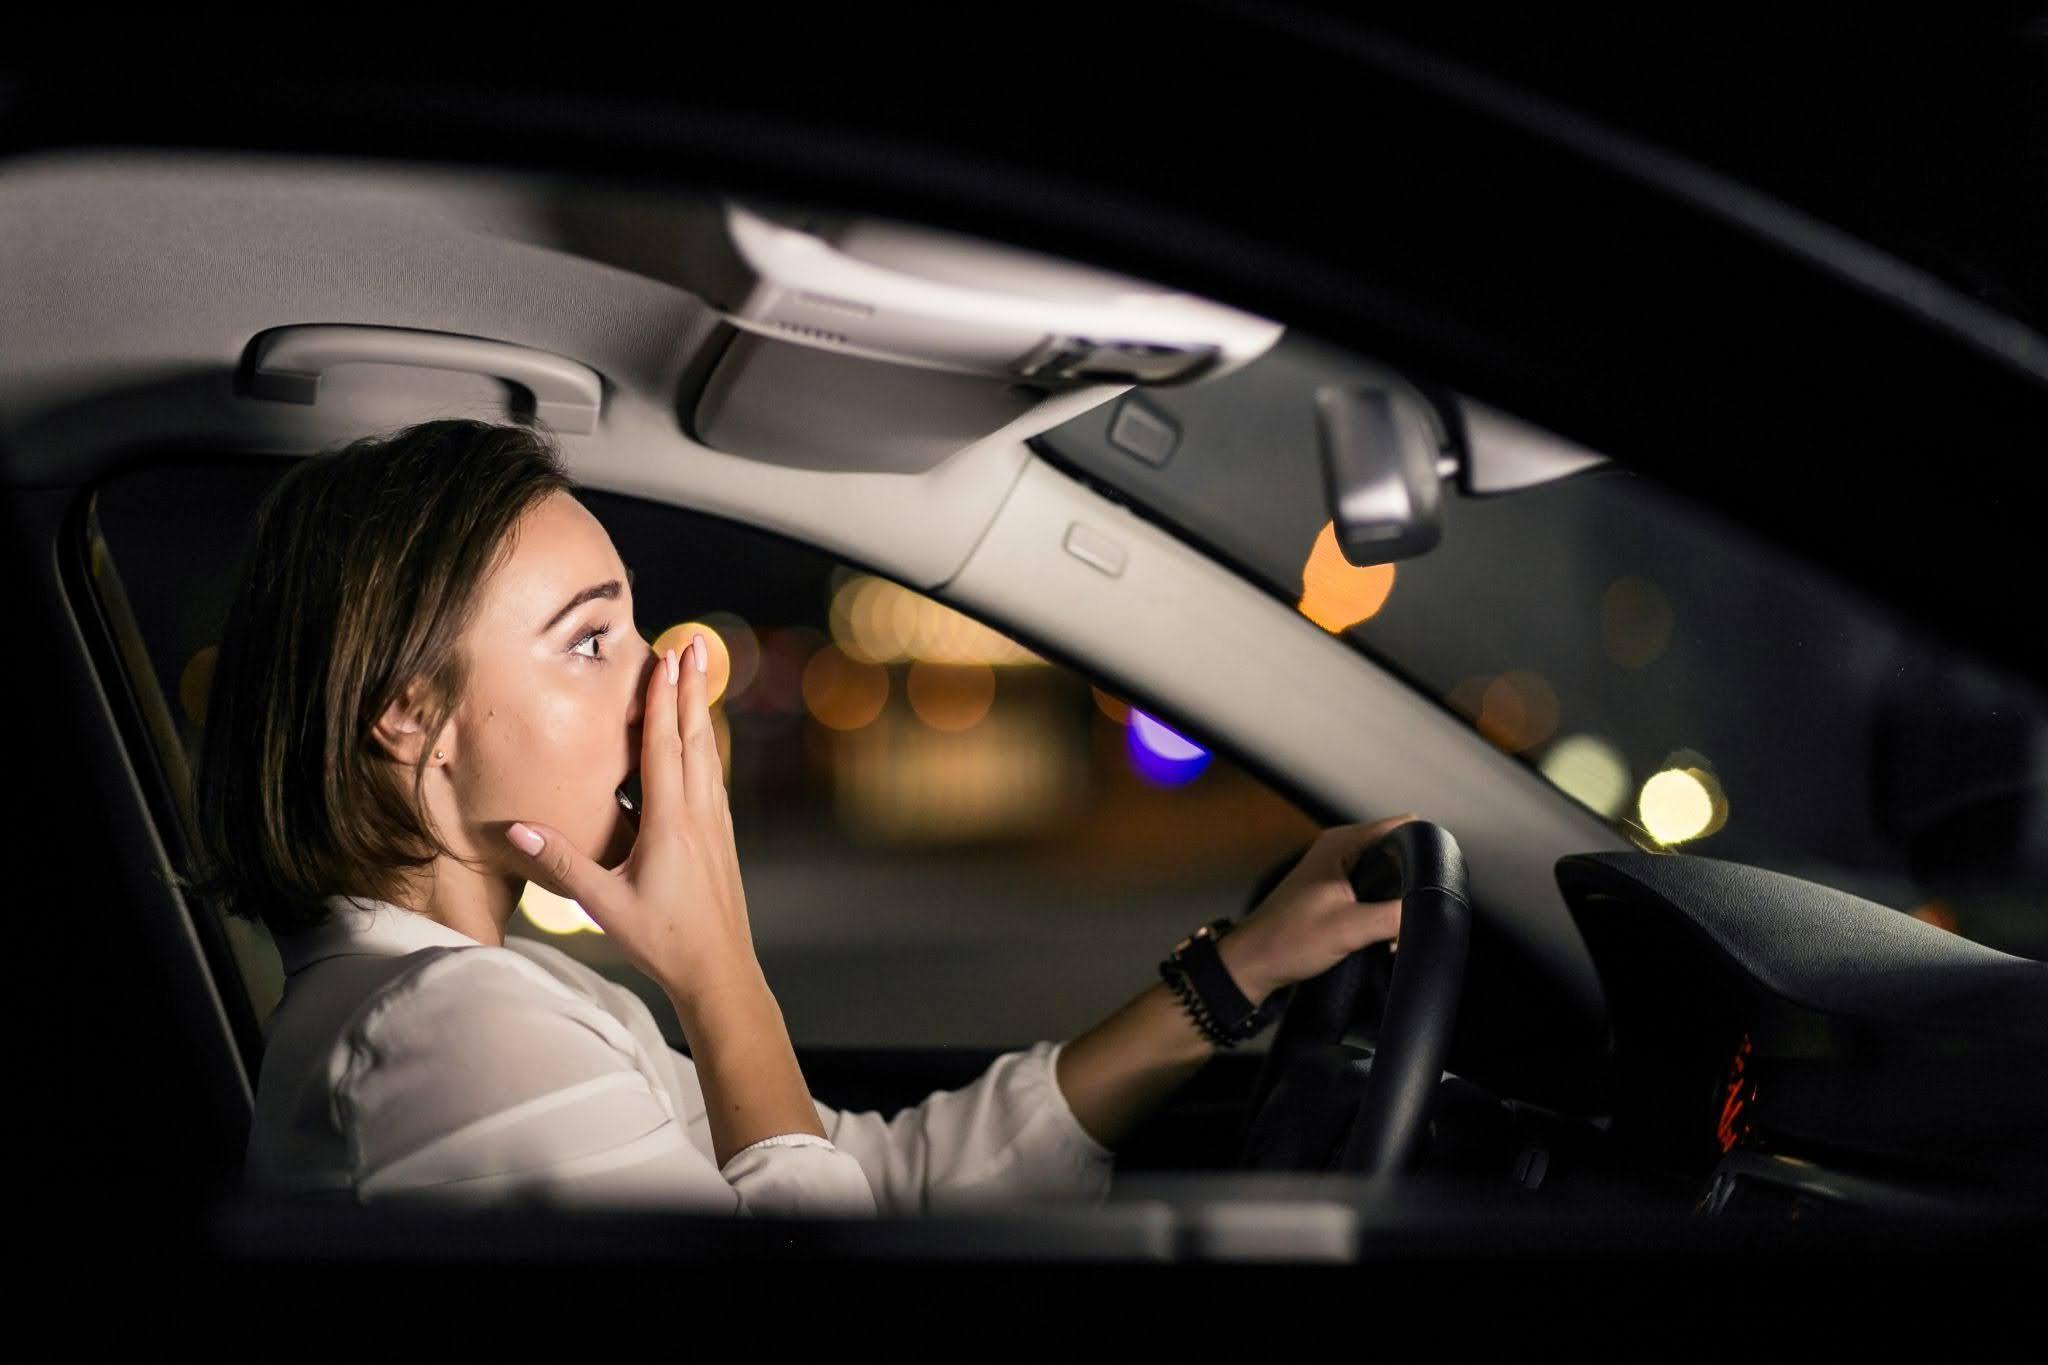
Few numbers in accident reconstruction carry as much weight or are misused as often as driver reaction time.
Most people assume it’s about a second and a half, occasionally two and a half for nighttime. In fact, the belief that attentive drivers share a single, fixed reaction time has propped up many analyses that do not withstand closer inspection.
The truth is more nuanced, and considerably more interesting. Reaction time while driving isn’t a fixed figure stamped on the human brain. It shifts with the situation, the information available to the driver, and how likely the driver was to see danger coming in the first place.
Understanding this variability is what separates a defensible analysis from a guess.
The Problem with One Reaction-Time Number
Crash analysis sometimes relies on a fixed response-time value. The analyst selects a number, inserts it into a stopping-distance calculation, and decides whether the driver had enough time to avoid the collision.
The method looks objective because there’s math behind it. However, the number may not match the event being studied.
Years of research show that drivers respond differently under different circumstances. In some situations, they react quickly; in others, noticeably slower. A driver braking for a child who darts out from between parked cars isn’t operating under the same conditions as a driver approaching a stalled vehicle on a dark interstate.
When you apply one universal driver response time to every case, the analysis stops reflecting reality and starts oversimplifying it. And in a courtroom, a single-number approach is one of the easiest positions to challenge on cross-examination.
With more research available today than ever, opposing counsel can quickly pick apart an analysis built on a value that ignores the specifics of the scenario.
What Perception-Response Time Really Measures
Driver perception-reaction time is the full window from the moment a driver recognizes a hazard to the moment they complete a physical action to avoid it.
Here’s how it usually plays out:
- The driver detects something in the traffic scene
- The driver recognizes it presents a hazard
- The driver decides what to do: lift off the throttle, apply the brakes, or steer away
Perception-response time encompasses the entire span, from recognizing the hazard to the physical response.
Where you stop the clock is important, too. One study might stop it the moment the driver lifts off the accelerator (Reaction Time). Another stops it when the driver touches the brake (Brake Response Time). A third waits for full braking (perception Response Time). These studies aren’t measuring the same thing.
Before borrowing a number from research, you have to know where the clock started, where it stopped, and what the driver was asked to do.
What Makes an Attentive Driver React Faster?
Attentive drivers tend to react faster when they get clear, useful information.
Consider a vehicle drifting into the driver’s lane. The movement provides a warning. The driver may begin preparing before the vehicle fully crosses the lane line.
Now picture a dark object in the roadway at night. The driver may be looking forward, yet the object may not be illuminated enough to be recognized until the vehicle is much closer.
The driver is attentive in both examples. The quality of the information is different.
Expectation also affects response. Familiar situations, like traffic slowing ahead or a car changing lanes, give drivers a head start on reacting.
A stopped car in a fast-moving lane, or a pedestrian somewhere you’d never expect one, is far less common. The more surprising the event, the longer it can take to recognize, though a sudden, obvious threat can trigger a quick, startled reaction.
Why Nighttime Crashes Change the Analysis
Nighttime driving is a clear example of why you can’t separate driver reaction time from recognition.
A driver can be looking right at a pedestrian, vehicle, or object and still not realize it’s there until there’s enough light to make out the details.
At DRI, we break recognition down using CLAPS:
- Contrast
- Lighting
- Anticipation
- Pattern
- Size
Put simply, these factors ask whether the object stands out, gets enough light, shows up where a driver might expect it, follows a familiar shape, and gives the driver enough to identify it. Headlight type, rain, windshield tint, roadway lighting, oncoming glare, and where the pedestrian is standing can change how far away a driver can recognize the hazard.
Essentially, the clock for perception-response time should start when the driver could realistically recognize the hazard, not when the object first happened to be somewhere in the scene.
How Reaction Time Changes Stopping Distance
Reaction time while driving decides how much road is left once braking begins.
At 68 miles per hour, a car covers about 100 feet every second. A one-second response eats up about 100 feet before the brakes even come on. A two-second response burns through about 200 feet.
During this time, the car barely slows down, if at all. It keeps rolling toward the hazard while the driver notices it, recognizes it, decides, and acts.
Stopping distance has two main parts:
- Perception-response distance: The distance traveled before braking begins
- Braking distance: The distance needed after the driver applies the brakes
A simplified formula usually assumes one set response time and maximum braking. But real drivers don’t all brake to the car’s full limit. Some ease into it. Some slam it. Some steer instead. Some do a little of both.
Also, once the driver acts, rain, snow, road surface, tires, and even the slope of the road can change what happens next. A proper analysis keeps the driver’s response separate from the car’s physical stopping ability.
What Does “Typical” Really Mean?
A typical response isn’t the fastest one possible. It’s also not a promise that every attentive driver will react within that time.
Research usually shows a spread. Some drivers react quickly while others react slowly. Most land somewhere in the middle.
Suppose an analyst uses the average driver reaction time from a study. An average may sit near the 50th percentile, meaning roughly half the drivers in the study reacted more slowly.
If only the average driver could avoid the crash, it may not be accurate to say the driver’s failure to avoid it proves inattention.
The better question is:
How did the subject driver’s response compare with the range shown by attentive drivers in a closely matched scenario?
It gives the judge or jury a full useful baseline without turning the analyst’s personal expectations into scientific evidence.
How Distraction, Fatigue, and Impairment Fit In
Distracted driving can lead to many crashes. But a crash on its own doesn’t prove the driver was distracted, tired, or impaired.
The better approach is to first look at how attentive, alert, sober drivers responded in similar conditions, then compare the subject driver against the research.
If the driver falls within the normal range, the presence of a phone, fatigue, alcohol, or medication doesn’t automatically mean any of those things slowed them down.
If the response falls well outside the range, then it’s worth looking at whether one of those factors explains the delay.
This method prevents a common error: “The driver crashed, so the driver reacted too slowly.” Some crashes simply can’t be avoided, because the hazard doesn’t become recognizable until it’s too late. A driver can react perfectly normally and still run out of room.
How Response Helps Analysts Find the Right Research
Tracking down the right response-time study can eat up hours. You have to find the research, dig into its methodology and timing, and decide whether its conditions match your crash.
Response pulls all of it into one place.
The software draws on more than 1,000 published, peer-reviewed studies. You enter the details of the crash, and it points you to research tied to lighting, response, braking, recognition, and avoidance.
Because the source material is available inside the platform, analysts can review and verify where the information came from.
And when a scenario doesn’t match a study perfectly, you can pinpoint the difference and explain it, so another expert can follow your reasoning and review the same sources.
A Better Answer to the Reaction-Time Question
Attentive drivers aren’t machines with one fixed delay built in.
They notice, interpret, decide, and react based on whatever information they have in the moment. Change the information, and the response changes with it.
For crash reconstructionists, the job isn’t to grab a familiar number and work backward. It’s to study the event, find the closest research, and compare the driver against what attentive drivers did under similar conditions.
Response makes this process faster, clearer, and easier to verify.
To explore Response, take a look at its research tools, or see how it can support your next driver-behavior analysis, contact the Driver Research Institute to schedule a demo.