
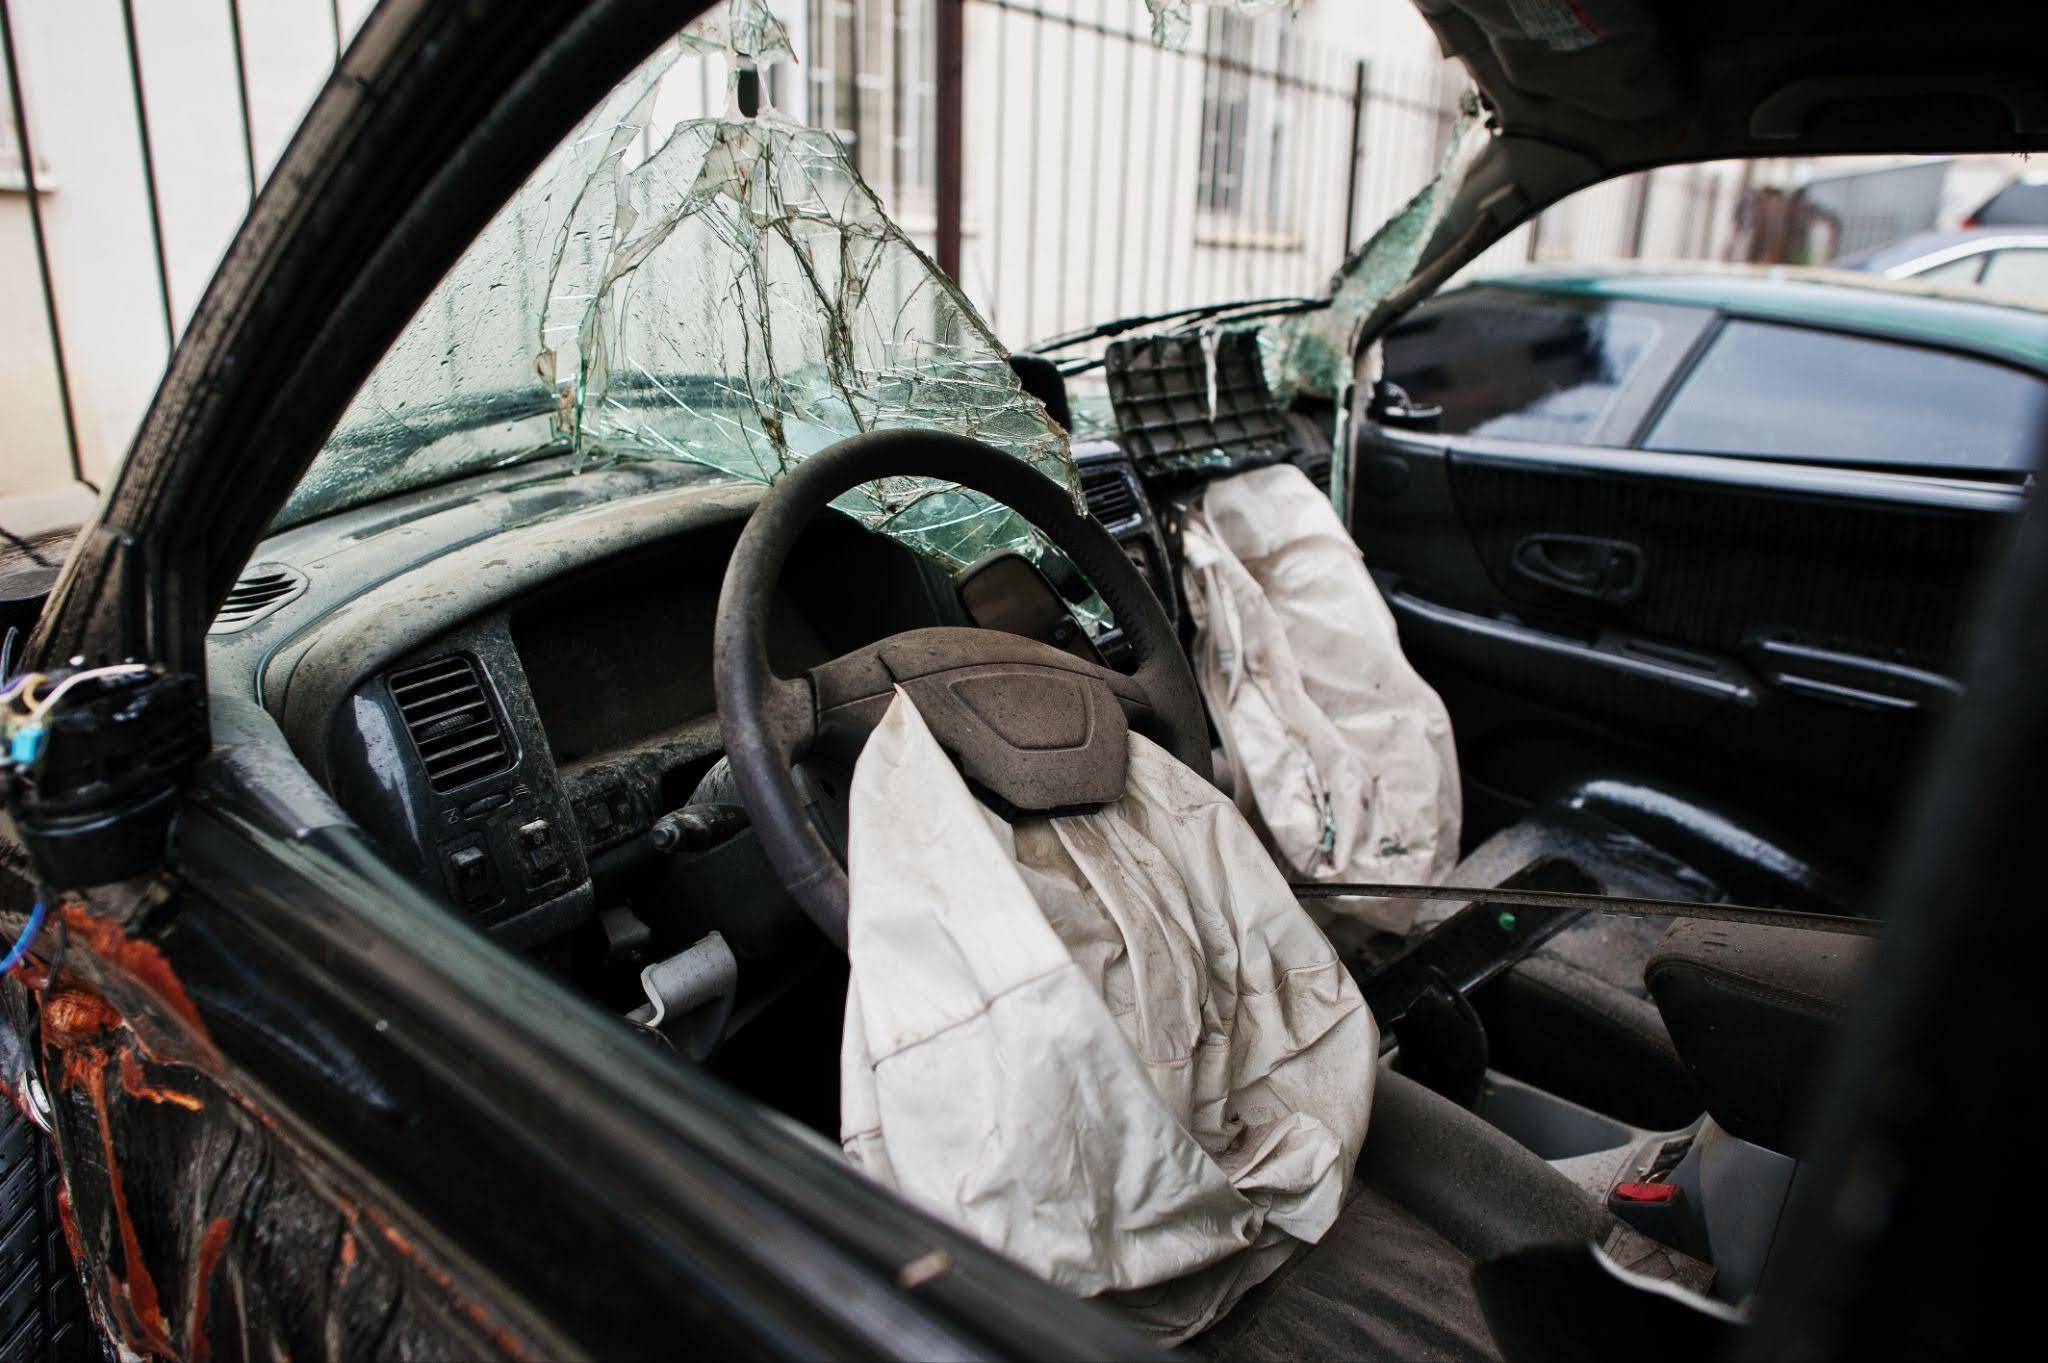
Every crash analysis eventually arrives at the same point.
A reconstructionist can measure skid marks, calculate impact speed, and model exactly how far a pedestrian traveled after being struck. The work is rigorous, and the software behind it is dependable. However, when the report lands on an attorney’s desk or gets challenged in a deposition, the debate rarely stays on the physics. It moves to the driver.
- When did they see the hazard?
- How much time did they have?
- Would a typical driver have avoided this crash, or was it already unavoidable by the time recognition was even possible?
Most accident reconstruction tools were never designed to answer these questions. Response software was.
The Missing Human in Crash Reconstruction
Traditional crash reconstruction software is great at physics. It can show you how a vehicle moved and what happened once the driver hit the brakes or turned the wheel.
What it usually can’t show you is what the driver was doing before any of this started.
How long does recognition take? Would the driver expect the hazard? How do darkness and glare change visibility? Did the response fall within a normal range? These human factors questions require more than a formula or one reaction-time number.
Response software adds published driver behavior research to the reconstruction. It gives analysts a way to compare the subject driver with drivers who faced similar conditions in controlled studies.
Why One Reaction-Time Number Falls Short
One of the most common shortcuts in crash analysis is handing every driver the same reaction time, no matter the situation.
While it makes the math easier, it just doesn’t reflect how people behave on the road.
Drivers tend to respond quickly when a hazard is familiar, likely, or sudden. A stopped vehicle on a high-speed road can be surprisingly hard to identify as stationary. On the other hand, a pedestrian on a dark road might not become recognizable until the vehicle is almost on top of them.
Contrast, glare, rain, headlight type, and expectation can affect recognition. And even within a single scenario, there’s a spread: some drivers react faster, some slower, and most land somewhere in the middle.
Response software does not force every case into one number. It helps the analyst identify research that matches the crash type, the information the driver had, the conditions, and the task in front of them.
Gap 1: Finding Research That Fits the Case
Human factors research is spread across journals, conference papers, transportation studies, and technical publications. Tracking down a relevant study can eat up hours, and that’s before you’ve even confirmed whether its timing, hazard type, driver population, and test conditions line up with your case.
Two studies can both talk about “response time” while measuring completely different things. One might start the clock when a hazard appears. Another might start it when the hazard becomes recognizable. One might stop at accelerator release, another at brake application.
If you miss this distinction, your numbers can drift off course.
Response pulls from more than 1,000 published, peer-reviewed studies. You enter the facts of the case, and it points you toward the right research.
Additionally, the platform doesn’t hide the source material. You can open the study, see how the data was collected, and explain exactly why it applies. So, you’re saving hours of literature review without losing any of the methodology you’d need to defend the work later.
Gap 2: Accounting for Human Variability
Crash opinions start to fall apart when they lean on the “average driver” as if one person somehow represents everyone.
But average sits in the middle of a range. If the average driver only barely avoids a crash, a huge share of drivers wouldn’t have avoided it at all.
Response lets you look at the whole range instead of one theoretical person. Rather than asking, “Could a driver have stopped?” you can ask how the fastest, slowest, and most typical drivers would have handled the same conditions.
Because there’s a big difference between a crash only the quickest drivers could avoid and one nearly any attentive driver would have.
Gap 3: Examining What Happened Before the Emergency
A lot of reconstructions start the moment the driver brakes or swerves. But driver behavior starts well before that.
A driver who spots a developing situation might ease off the accelerator, back off their following distance, or get ready to change lanes. These small moves buy time before things take an urgent turn.
Other drivers hold their speed or miss the early warning signs. By the time they react, the hazard is already immediate.
Response helps analysts study both the non-immediate hazard phase and the emergency phase. The wider view can reveal whether the crash was linked to a late emergency response or an earlier missed opportunity.
Gap 4: Separating Late Recognition from a Slow Response
When a driver hits a pedestrian at night, it’s easy to label them inattentive simply because the crash happened.
The label is typically wrong.
Maybe the pedestrian was easy to see, and the driver genuinely responded slowly. Or maybe the pedestrian didn’t cross the recognition threshold until the last second, leaving even a sharp, attentive driver with no real chance to stop. These are two very different stories, and they lead to two very different conclusions.
Response helps you tell them apart.
The platform includes recognition-distance research based on clothing color, object type, movement path, ambient lighting, streetlights, headlight type, and position. Analysts can also account for rain, oncoming glare, windshield tint, and the CLAPS factors: contrast, lighting, anticipation, pattern, and size.
Once you can estimate when the hazard became recognizable, you can start the response-time analysis from a defensible point, rather than assuming the driver should have seen it the instant it entered the road.
Gap 5: Improving Stopping-Distance Analysis
Stopping distance has two main parts.
The first is perception-response distance, or how far the vehicle travels while the driver recognizes the hazard, decides what to do, and starts a physical response.
The second is braking distance, or how far the vehicle travels after braking begins.
Simplified formulas can trip over both. If the selected response time does not match the crash scenario, the first distance may be too short or too long. If the calculation assumes every driver applies maximum braking, the second distance may also be unrealistic.
Drivers do not all brake at the maximum capability of the vehicle and road surface. Research shows a range in how drivers apply the brakes, even during emergencies.
Response brings driver-selected braking behavior into the calculation. It can compare typical braking force, response timing, speed choice, and other human inputs with the crash facts.
At 68 mph, a vehicle covers roughly 100 feet every second, so even a small shift in recognition or response time can erase a large chunk of the distance a driver had to work with.
Gap 6: Testing Claims About Distraction, Fatigue, and Impairment
Just because a driver was distracted, tired, or had been drinking doesn’t automatically mean their response was slow.
The stronger approach is comparative. First, figure out how attentive, alert, sober drivers responded in similar conditions. Then measure the subject driver’s response against that group.
If they fall outside the expected range, now you’ve got an evidence-based footing to talk about whether distraction, fatigue, or impairment influenced the outcome. Response supports this comparison and moves the opinion away from personal assumptions.
Gap 7: Building an Analysis That Can Be Checked
In litigation, a conclusion on its own isn’t enough. You have to show where the information came from, why it fits the case, and how you applied it.
Response is fully transparent. The research source behind every value lives right inside the platform, so another analyst can pull it up and check your work.
A single-number opinion is easy to pick apart, because response time genuinely changes with hazard type, expectation, lighting, and visibility. A case-specific opinion holds up far better, because you can explain what information the driver had, when the hazard became recognizable, which studies matched the conditions, and where the driver landed within the observed range.
Response draws a clear line from the facts to the research, and from the research to the opinion.
From IDRR to Response
Response grew out of Interactive Driver Response Research, or IDRR.
IDRR started life as an Excel-based perception-response time tool. Over time, it expanded into acceleration, braking, steering, speed choice, recognition distance, and other driver behaviors.
The research eventually outgrew Excel. Response moved the same methodology into a web platform with more capacity, expanded nighttime tools, and thousands of headlight maps.
The name says exactly what the product studies: driver response.
Final Thoughts: Put the Driver Back Into the Reconstruction
Crash reconstruction should explain more than how the vehicle moved.
It should address what the driver could see, when the hazard became recognizable, how drivers respond in similar situations, and whether the crash could reasonably have been avoided.
Response fills the gap between vehicle physics and human behavior. It helps reconstructionists find relevant research faster, apply it to the case, account for driver variability, and show every source behind the analysis.
What you end up with is a picture of what the driver faced, and how their response stacks up against real people in the same conditions.
Curious how that would look in one of your own cases? Reach out to the Driver Research Institute, and we’ll walk you through Response with a scenario that mirrors the work you’re already doing.